We discussed the complete PeopleCode example to create a chart for a PeopleSoft application. We will expand the example to see how many different chart types are possible for the sample code we created. Note that we created a 2D stacked bar chart in the previous case. Changing just the chart type code to the ones provided below would give you multiple chart options while you are completely inside PeopleCode..No Javaobject , all PeopleCode..
1) To create a Two Dimensional (2D) bar chart use %ChartType_2DBar. An example for this chart type in our case is provided below;
 |
| PeopleCode - 2D Bar Chart Example |
2) To create a Two Dimensional (2D) percent bar chart, use the option %ChartType_2DPercentBar. In this case, the values are spread to the 100% scale which you can see from the example graph created through PeopleCode below;
 |
| PeopleCode 2D Percentage Bar Chart Example |
3) We created a vertical stacked bar chart in part 2 of this post. If you want your chart to be horizontally stacked, you can use the option %ChartType_2DHorizStackedBar for your chart type. An illustration of this chart, for the same example we used is provided below;
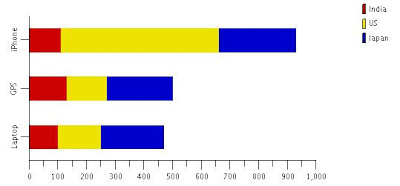 |
| PeopleCode 2D Horizontal Stacked Bar Example |
4)For the same example, to create a 2D line graph use the built in function %ChartType_2DLine for chart type. An example of line chart creation in PeopleSoft is given below;
 |
| PeopleSoft 2D Line Graph Example |
5) For the same case, a 2D histogram chart provided as a chart type with the option %ChartType_2DHistogram produces an output image as shown below;
 |
| 2D Histogram Chart Example |
6) Creation of charts in PeopleCode is not restricted to 2D alone. You can also create charts in 3D (three dimensional charts). To create a 3D bar chart for the example we discussed, use the chart type as %ChartType_3DBar. When you use this chart type, PeopleSoft produces a 3D bar chart as shown below;
 |
| 3D Bar Chart Example |
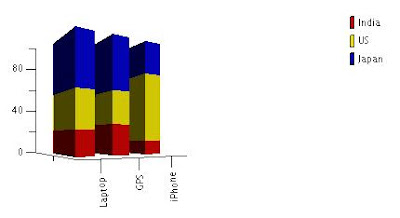
7) Why to restrict ourselves to a 2D bar stacked bar chart? Can't we create a 3D stacked bar chart in PeopleSoft? (vertical stack). Yes, you can create a 3D stacked bar chart through PeopleCode by using the built in function %ChartType_3DStackedBar as chart type. An example of a 3D stacked bar chart created through PeopleCode is as below;
 |
| 3D Stacked Bar Chart Example |
8) We saw how to create a 2D vertical percent bar earlier. PeopleSoft also provides an option to create 2D horizontal percent bar chart. This is accomplished by the built in function %ChartType_2DHorizPercentBar as chart type. Output below;
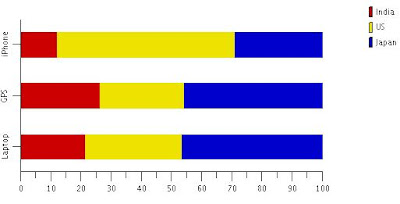 |
| 2D Horizontal Percent Chart Example |
9) If you want to create a 3D percent bar chart from PeopleCode, you just have to change the chart type to %ChartType_3DPercentBar. A 3D percent bar chart is provided below for the same example;
 |
| 3D Percent Bar Chart Example |
10)Each and every chart in PeopleSoft is unique. Here is a 2D horizontal bar chart example. (not a stacked one). Change the chart type to %ChartType_2DHorizBar for this to work.
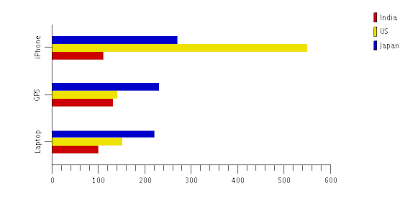 |
| 2D Horizontal Bar Chart Example |
In the upcoming posts we will discuss pie charts and some of the chart options. We will also provide a working example of creating charts in PeopleCode through third party libraries like Raphaël.
No comments:
Post a Comment