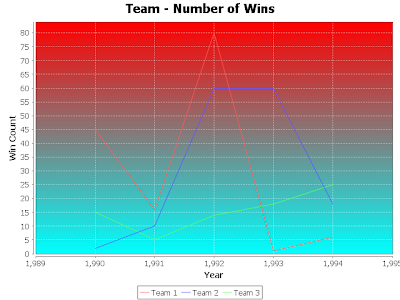
Set Background Paint - Transparency for JFreeChart graphs:
In this post, we will introduce two popular methods in JFreechart Plot options, that will help you to set the background paint color of chart and specify the color transparency as a value between 0 and 1, with number of examples. We will provide only clipped version of code and you need to use the XY Line Chart tutorial, for seeing the full examples in action. Let us get started with the examples.
setBackgroundPaint - change chart plot background color
This method is used to set the background color of the chart plot area and is defined in org.jfree.chart.plot.Plot. It takes an input of the type java.awt.Paint. This means you can set the background color to a fixed color, your own RGB color values, a gradient color or even a texture background.
setBackgroundAlpha - change color transparency / alpha
This method takes a float value through which you can specify the transparency of the background color applied to the chart. A value of 0 indicates complete transparency of the color, and a value of 1 is full opaque background.
We will now discuss some examples of these values applied to actual charts and examine the output in each of these cases.
Fixed Background Colors and Alpha:
Here is a chart that is produced by setting chart color to GREEN by using java.awt.Color class, and alpha to 0.2f. First the code snippet;
                xyPlot.setBackgroundPaint(Color.GREEN);
                xyPlot.setBackgroundAlpha(0.2f);
The output chart is shown below
 |
| java.awt.Color as Background Color with high transparency / alpha - output example |
The same chart without any alpha produces a bright green as shown below (just comment the setBackgroundAlpha line)
Gradient Chart Background with Alpha:
You can also have a gradient color as chart background as java.awt.GradientPaint is a subclass of java.awt.Paint. We will see some Gradient background examples for chart with Alpha.
The output of this code is shown below:
The same background gradient without alpha is produces a dark variant as shown below:
Custom RGB Colors as Background
You can beautify your chart area with a custom RGB color of your choice too!. The code to do that is very simple and is given below:
27, 27, 220 are the values for Red, Green and Blue respectively. You can specify a value between 0 and 255. The output chart is shown below:
And the same output without Alpha
These are just examples. The color variation that you can get is virtually endless. You can even have texture backgrounds for your chart if required by following the same approach. More on this later. That completes our crash course on background color and alpha, in JFreeChart charts. See you in a different example next time.
 |
| Only Background Color - No Alpha - Output Chart Example |
You can also have a gradient color as chart background as java.awt.GradientPaint is a subclass of java.awt.Paint. We will see some Gradient background examples for chart with Alpha.
                xyPlot.setBackgroundPaint(new GradientPaint(0, 0, Color.cyan, 200,200, Color.red, false));
                xyPlot.setBackgroundAlpha(0.5f);
The output of this code is shown below:
 |
| Gradient Chart Background with Alpha - JFreeChart Output Example |
 |
| Full Gradient Background - without Alpha - Output Example |
You can beautify your chart area with a custom RGB color of your choice too!. The code to do that is very simple and is given below:
                xyPlot.setBackgroundPaint(new Color (27, 27, 220));
                xyPlot.setBackgroundAlpha(0.3f);
27, 27, 220 are the values for Red, Green and Blue respectively. You can specify a value between 0 and 255. The output chart is shown below:
 |
| Custom RGB Background with Alpha - JFreeChart Output |
 |
| Custom RGB - No Alpha - JFreeChart Java Output Example |
These are just examples. The color variation that you can get is virtually endless. You can even have texture backgrounds for your chart if required by following the same approach. More on this later. That completes our crash course on background color and alpha, in JFreeChart charts. See you in a different example next time.
No comments:
Post a Comment